Exor, the holding company the Agnelli family controls through Giovanni Agnelli B.V., keeps score with net asset value (NAV) per share, which its results releases set against the MSCI World Index. Exor is listed on Euronext Amsterdam and has outside shareholders, so it is not a family office, but any family holding can learn from its scorecard. Our Exor profile lists its holdings.
This post explains what Exor measures, its debt and cost limits, and why its shares trade far below NAV. Part 1 covers Fiat and IFI, Exor’s forerunner.
How Exor Measures NAV per Share Against the MSCI World
Exor defines NAV as its equity under IFRS, the international accounting standards, and gross asset value (GAV) as its total assets. NAV per share divides NAV by the shares outstanding: shares issued, less those Exor holds itself.
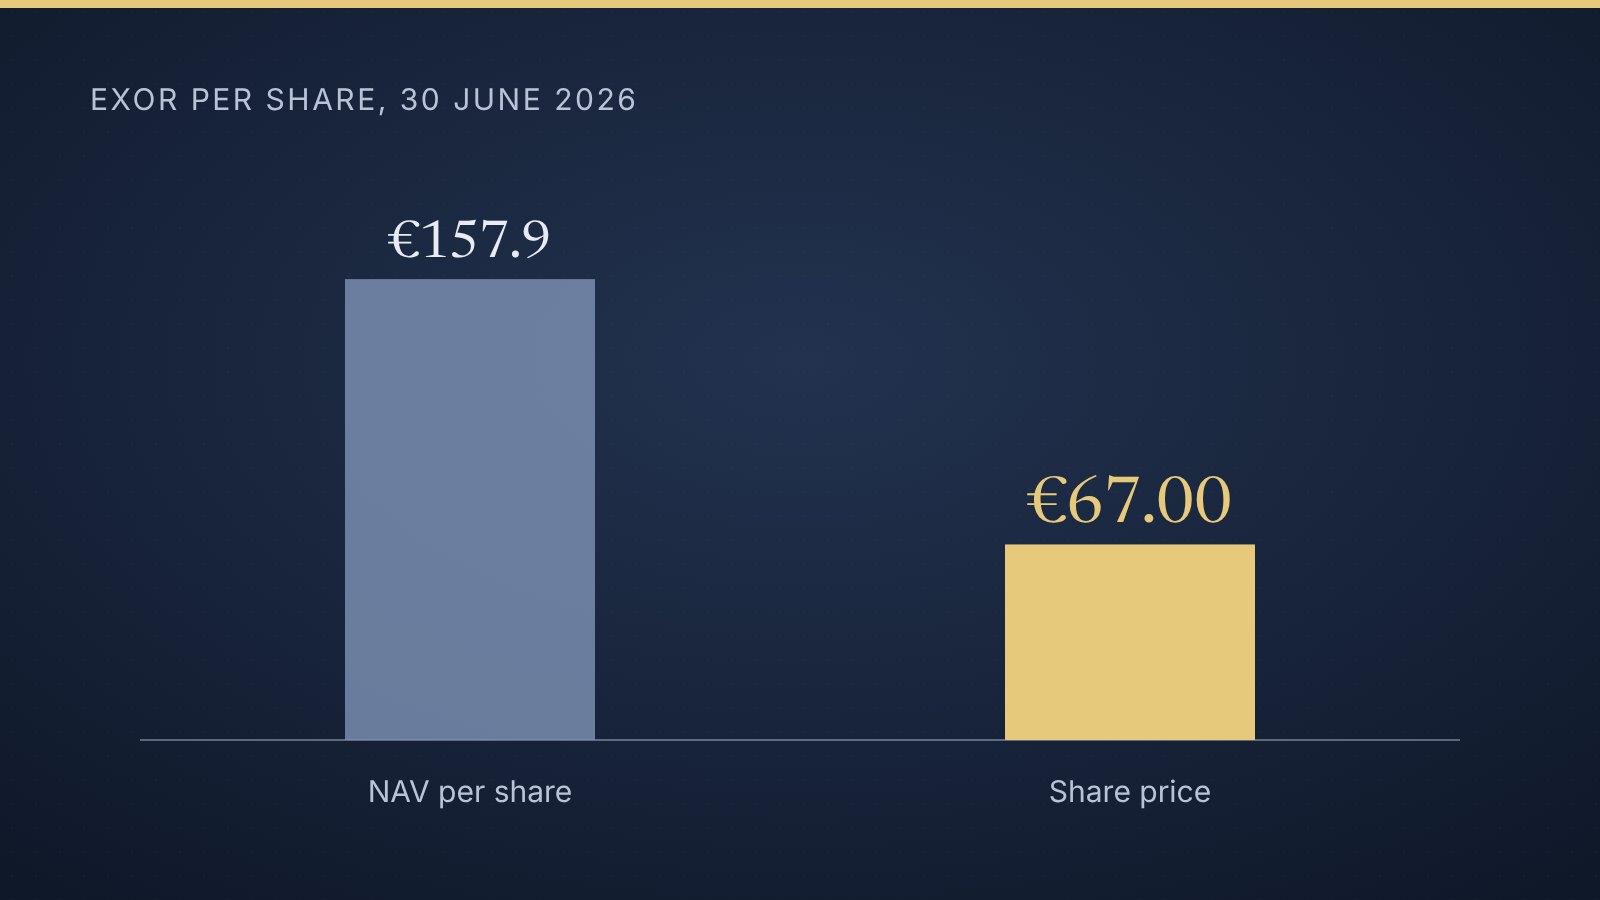
At 30 June 2026 NAV was €32,009 million, or €157.9 per share, according to Exor’s half-year report (September 2026). GAV was €35,768 million; gross debt of €3,691 million makes up most of the difference.
The benchmark is the MSCI World Index, which measures share markets in 23 developed countries, according to MSCI. Exor reports:
- 1 March 2009 to 30 June 2026: NAV per share grew 15.5% a year, compounded, against 12.0% for the index. 2009 is the year IFI merged with IFIL and was renamed Exor.
- 2025: NAV per share fell 8.1% while the index rose 5.4%. Exor cited challenges at its largest companies.
- First half of 2026: NAV per share fell 3.9% while the index rose 11.8%, mainly because Stellantis’s share price fell.
How Exor Caps Debt and Running Costs
Exor has set three targets, measured annually: a loan-to-value (LTV) ratio below 15%, management costs below 10 basis points of GAV, and free cash flow above the dividends it pays (a ratio above 1.0x). A basis point is 0.01%.
LTV compares debt and other liabilities, net of cash, with assets other than cash. It was 6.9% at the end of 2025 and 4.7% at 30 June 2026, while cash rose from €1,408 million to €2,179 million. Most of the debt is bonds (€3,507 million); its average maturity is about six years and its average cost 2.7%. S&P Global Ratings rates Exor A- with a stable outlook.
Management costs were €11 million in the first half of 2026, or 3.1 basis points of GAV. This adjusted measure leaves out share-based pay (€14 million) and one-off costs (€5 million); general and administrative expenses under IFRS were €30 million.
Why Exor Trades Below NAV, and How Buybacks Fit
At 30 June 2026 Exor’s share price was €67.00, a 57.6% discount to NAV per share, its half-year report shows: about 42 cents for each euro of net assets. Chief executive John Elkann said in September that the shares “continue to trade at a substantial discount to NAV”.
Buybacks are one response. A holding that buys and cancels its own shares below NAV raises the NAV per share of the shares left, though cash falls. In April 2025 Exor bought back 12,254,495 shares for €1 billion, about €81.60 each, in a tender offer; 6,985,062 came from Giovanni Agnelli B.V. (Part 5 covers the ownership chain.) Exor said the buyback supported NAV per share, which beat the index by 5 percentage points in the first half of 2025.
On 22 September 2026 Exor announced a buyback of up to €500 million, to run until its March 2027 results. By 16 October it had bought about 1.56 million shares for about €109 million, in a first tranche of up to €125 million. The dividend is smaller: Exor proposed €0.49 per share in March 2026, about €100 million, under 1% of the €67.00 share price.
A fair caveat
NAV is an accounting figure, not a market price, and depends on how each holding is valued. Exor chose the benchmark and start date; other dates give other results, and the half-year report does not give the index’s currency. The reports we read do not say why the discount is so wide. Share-based pay, left out of management costs, is still a cost to shareholders.
Five lessons to take away
- Pick one headline number. Exor’s results releases compare NAV per share with the index.
- Compare it with an alternative. A broad index shows whether choosing stakes paid off.
- Report bad periods on the same basis. Exor published its 8.1% fall in 2025 beside the index’s 5.4% rise.
- Write down limits on debt and costs. Clear ceilings make drift easy to spot.
- Check what an adjusted figure leaves out. Exor’s €11 million of half-year costs excludes €14 million of share-based pay.
For a family office
A family holding, listed or not, can ask: what is our one scorecard number, and against what benchmark? How much debt do we allow against our assets, and what does running the holding cost each year? If a family member wanted to sell, at what discount to NAV would a buyer pay? These are questions to bring to your advisors, not advice.